
Large eddy simulations of wind-farms
Similar to other renewable energy sources, wind energy is characterized by a low power density. Large wind farms (on- and offshore) consisting of arrays of ever larger wind turbines are being envisioned and built in order to make considerable contribution to the world's overall energy supply. These wind-turbines interact with the environment over a wide range of length scales ranging from millimeters (viscous scales) and meters (wakes and tip vortices) up to ``geophysical scales" of hundreds of meters (inter-turbine spacing) to kilometers (wind-farms). The large scale separation makes analysis and design of wind-farms challenging from both a theoretical and a numerical perspective. However, a detailed understanding of the relevant physics is critical for efficient wind-farm designs that exploit the full potential of this important renewable energy source. High-fidelity simulations allow one to fully specify the conditions under which the wind-farm performance is tested. This makes simulations the ideal tool to obtain insight into the complex interactions that dictate wind-farm performance.
In this project we use large eddy simulations for the development of physics based models that can be used to predict the performance of very large wind-farms, see also Analytical modeling of wind-farms. Figure 1 shows a 3D perspective visualization of a Large Eddy Simulation (LES) computersimulation capturing the interaction between the atmosphere and a very large aligned wind-farm, see Ref. 3 and the corresponding press releases by AIP and FOM. The movie shows that turbulent wakes that are created behind the turbines. In addition, the simulation reveals that the wakes start to interact with each other further downstream. At the entrance of the wind farm white particles are periodically released. These particles spread very quickly and reveal the very turbulent nature of the flow in wind farms. Figure 2 shows the power output as function of the downstream direction for several wind farm configurations and reveals that the power output as a function of the downstream position becomes constant, see figure 2. In this fully developed region the wind-farm dynamics, which are dominated by the interacting wind-turbine wakes, are also influenced by the atmospheric flow above the wind-farm. In recent work we have for example investigated the effect of the wind turbine density on the performance of very large wind farms, Ref. 7, and the effect of the wind-farm size on the optimal turbine spacing [6]. 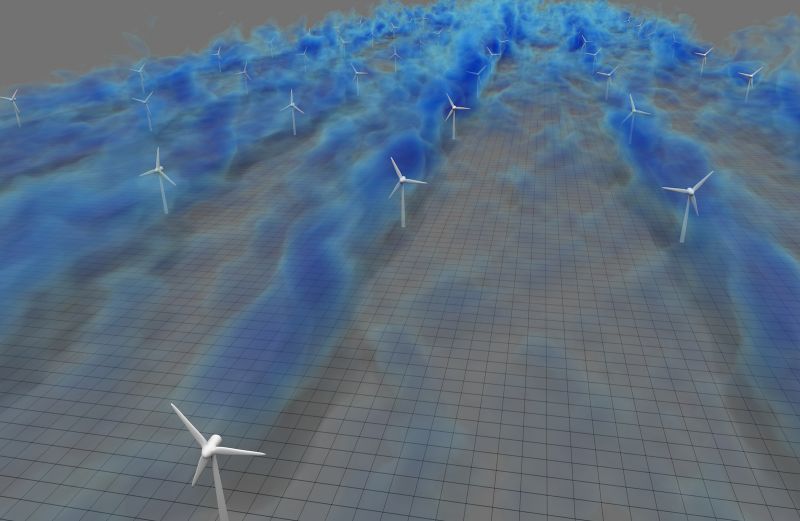
Figure 1: A three-dimensional visualization of the flow field in a simulated wind-farm. The blue regions indicate low velocity wind-regions. These low velocity wind-regions, which are known as wind-turbine wakes, are found behind the turbines. Visualization made by David Bock (XSEDE (Extreme Science and Engineering Discovery Environment).
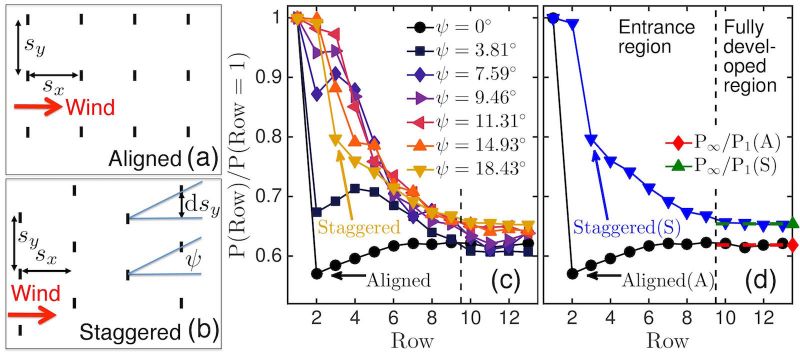
Figure 2: (a,b) Sketches of an aligned and a staggered wind-farm. The sketches show the definition of the streamwise sx and spanwise sy turbine spacing, which are non-dimensionalized with the turbine diameter D. Panel b also defines the alignment angle Ψ=arctan (dsy=sx) with respect to the incoming wind-direction. (c) Power output as a function of the downstream position for sx=7.85 and sy=5.24 and different Ψ. (d) Determination of the power output in the fully developed region (P∞/P1) for the aligned and staggered configuration.
Info: Richard Stevens
Fur further information, corresponding movies, available projects, and vacancies look at: http://stilton.tnw.utwente.nl/people/stevensr/
Researchers: Richard Stevens, Mengqi Zhang
Collaborators: Prof. Charles Meneveau (Johns Hopkins University), Prof. Dennice Gayme (Johns Hopkins University), Michael Wilczek (Max-Planck Institute Gottingen)
Embedding: JMBC
Sponsors: FOM(NWO-ENW),STW